Predicting Football Positions From Heatmaps With CNNs ⚽
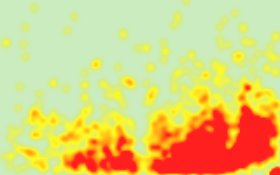
In this project, I use scraped heatmap data and position data from Sofascore and employ a Convolutional Neural Network (CNN) to predict player position based upon these heatmaps.

Introduction
Continuing from my research project with regard to football player valuation, I thought it would be interesting to see if I would be able to predict a players position using heatmap data and feeding it through a Convolutional Neural Network (CNN). The initial concept, while straightforward, evolved into a complex task encompassing data collection, preprocessing, model development, and optimisation. This page outlines the methods I used from initial stages of data collection to the final steps of model refinement and position prediction. The code that I used to web scrape and predict player position will also be available below.
Data Collection
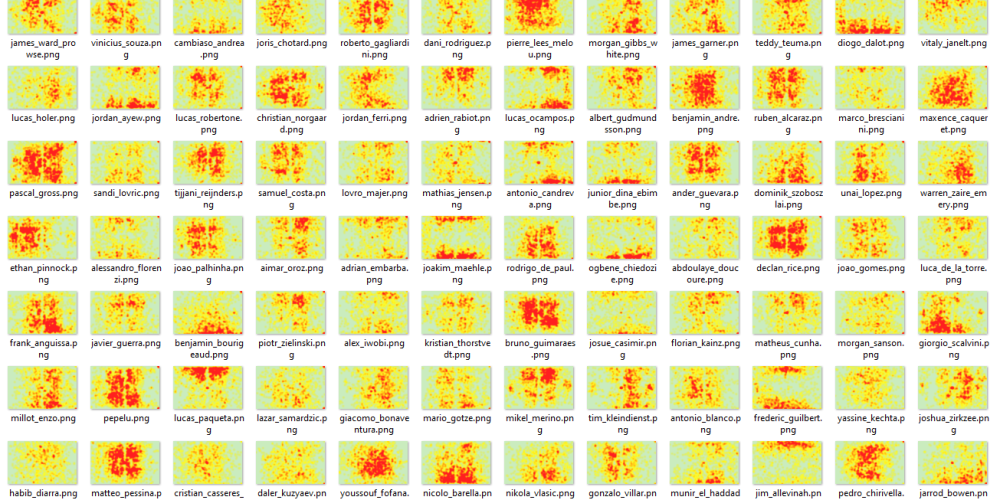
The initial phase of this research project focused on data collection, with the objective of acquiring heatmap data for football players. Sofascore emerged as a prime source, being among the few football data platforms to offer such information. The challenge then shifted to scraping this data effectively to create a dataset substantial enough for accurate model training.
To ensure a sufficiently large and diverse dataset, I opted to collect heatmap data from players across the top 5 European football leagues (

The scraping process proved time-consuming, taking approximately 6 hours to complete, and resulted in the collection of 2390 heatmaps. The procedure was not without its challenges; the script occasionally failed to allow sufficient time for page loads, resulting in missed heatmaps due to inadequate delay settings. To mitigate this issue, deploying the script on a virtual machine (VM) presents a viable solution. Running the scraping process on a VM not only lessens the computational burden on personal devices but also allows for extended uninterrupted operation, potentially enhancing data collection efficiency and reducing the likelihood of missing heatmaps.
Upon completing the collection of heatmap data, it became evident that labeling the data was a necessary step I had overlooked prior to initiating the scraping process. Given the impracticality of manually labelling 2390 heatmaps, I again turned to Sofascore to scrape positional data for players from the same top 5 leagues, storing this information in .txt files formatted as firstname_lastname_positions.txt. This process captured players with multiple listed positions, culminating in 2447 entries of player position data.
Despite minor inconsistencies due to variations in page loading times, I deemed the dataset—consisting of 2390 heatmaps and 2447 positional data entries—suitable for the next phases of my project. This comprehensive data collection effort now lays the groundwork for the forthcoming model development and training process. (NOTE: The more data the better, you could scrape data from every league if you had the time.)
For the code used to scrape heatmaps and positional data from Sofascore, you can view it here:
View code on Colab:
- Sofascore Heatmap Scraping.ipynb – This notebook scrapes heatmap data from all players in the top five European leagues.
- Position Data Scraping.ipynb – This notebook scrapes position data from all players in the top five European leagues.
View code on Github
Developing and Using The CNN For Position Prediction
To start off with the development of the CNN, the data had to be prepared. I started off with reading the heatmap image files and their correspoding labels from the two directories ‘images‘ and ‘positions‘. I then defined a function called ‘encode_positions‘ to convert player positions into a binary format suitable for training the CNN. Another function, ‘load_data’, was created to load and preprocess the heatmap images and position data. It is a simple function that resizes the images to consistent sizes of 280×175 pixels (not really required as the scraped images were consistent) and converts them from RGBA to RGB format.
After loading the data successfully, it was split into training and validation sets, with 80% of the data used for training and 20% for testing. To ensure the pixel values [0,255] are scaled between [0,1], I normalised the image data.
The CNN Architecture

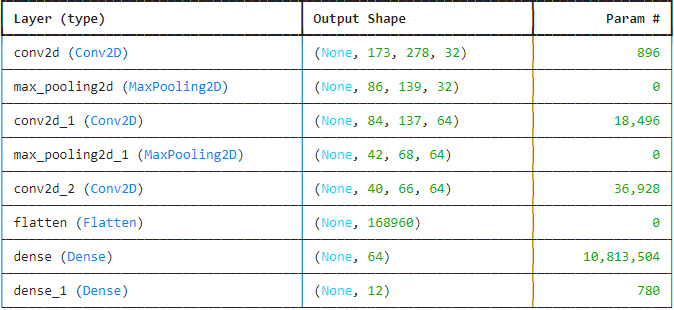
To design the CNN model architecture, I opted to use a sequential model with a linear stack of layers. The model consists of three convolutional layers with ReLU activation to introduce non-linearity. This is followed by max pooling layers to reduce spatial dimensions, and the output from the convolutional layers is then flatttened and passed through two dense layers where the final layer uses sigmoid activation to predict player position due to this being a multi-class problem.
This is a very high level explanation regarding the CNN architecture, for a more technical in-depth analysis, click here to read more.
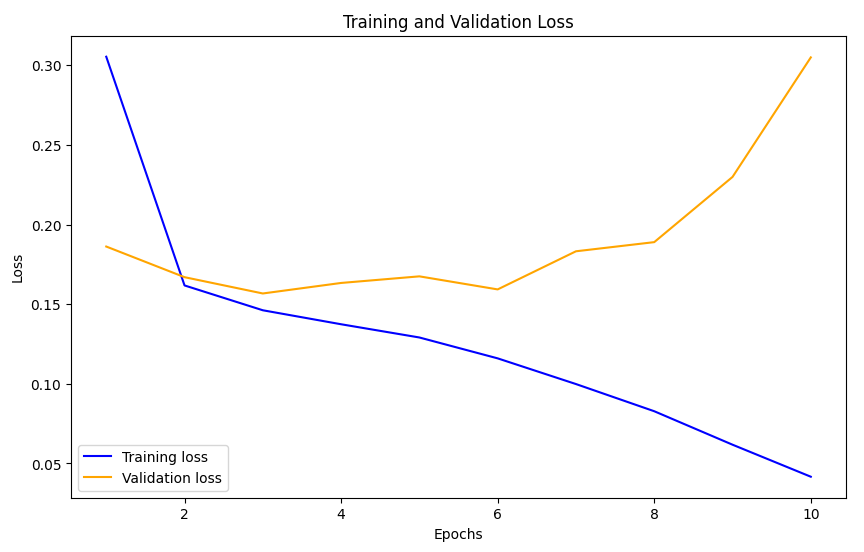
The model was then compiled using the Adam optimiser and binary cross-entropy loss due to it being a multi-class problem. The model was trained for 10 epochs, with 20% of the training data set aside for validation. After training, I plotted the training and validation loss over the epochs, it seemed the model began to overfit around the 7th epoch.

Finally, to test the model on unseen heatmap images, I scraped heatmap data from PSV Eindhoven, a team in the Dutch league. I defined a function called ‘preprocess_image‘ to prepare a single image for prediction. The model then predicted the positions for each player based on their heatmap and printed out their results in a readable format.

As seen in the image above, the model is able to provide multiple predictions for a player position. The model had a 60% accuracy for predicting player position, but this was expected due to there being multiple positions. The model was able to accurately identify goalkeepers due to them primarily being in the same spot for a game. Through manual spot checks the model was able to accurately identify players position where a player was dominant in a single location but for players who were spread throughout the pitch it struggled.
Future Improvements
There’s a lot that can be added to this project. Here are a few I’ve thought of:
- Scrape a lot more heatmap data. I used the top five leagues for this project but I can collect thousands more.
- Optimise the CNN. Make tweaks to the architecture to ensure higher accuracy rates.
- Reduce overfitting through use of ‘dropout’, increased data or regularisation techniques.
View code on Github


